Graph IDE
macOS / Productivité
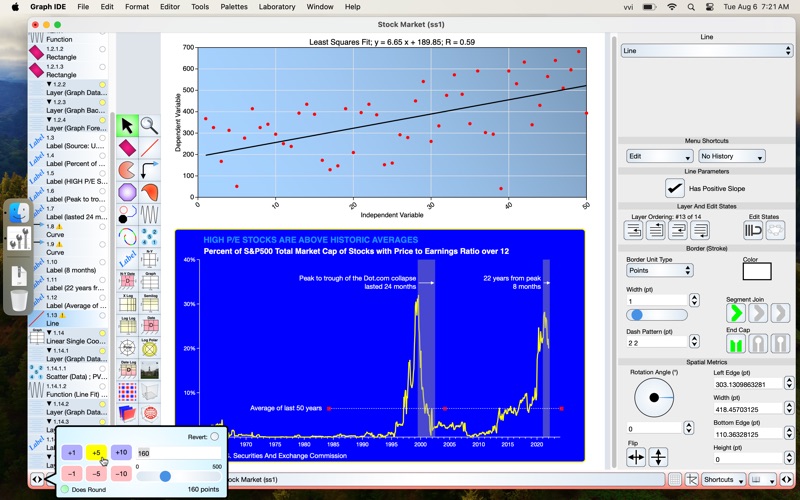
Graph IDE™ features, reliability and speed has been utilized by major corporations and is the tried and true data visualization (DV) tool by VVI®. It implements many DV qualities from rectilinear to non-linear and 3D graphs and blends that with the qualities of spreadsheet and graphic artist applications. The user interface is so advanced that no other application can even come close to its interface performance.
Open a CSV or tab-delimited file in the Finder to launch a document with a spreadsheet of your data and make a graph of it. Make beautiful publication-quality graphs and documents for reports. View and edit specific data points using the many point-and-click features and use formulas and programs to generate data. Gain access to extraordinary features such as multiple coordinate graphs with mixed linear, logarithmic or Gregorian axes. Drag and drop easy-to-use graphs and spreadsheets as a starting point. Many DV applications specify markers from a predefine palette only. Graph IDE implements palettes of markers but also allows for the creation of your own markers via its one-of-a-kind recursive user interface where the tools to make a document are also available to make a marker. Printing and page layout for multi-page documents is particularly robust and Graph IDE implements both tiling and page pagination features along with page scrubbing and overviews.
Graph IDE is accomplished because of its unique high-performance interface but also because behind the scenes it used advance programming concept implemented only by VVI®. Its source code is dynamically generated and uses code-theoretic transformations to produce highly optimized architectural-level structures. Such techniques are well beyond simple compiler optimizations.
Graph IDE stands on its own as a robust application. It also implements corporate workgroup features such as retrieving and coordinating documents from a cloud service, either on the Internet or collocated at a corporate site within a secure LAN. It includes a custom-made JIT compiler for efficient animation and also formula generation in spreadsheets. On the Mac, a bundle resource can be loaded to facilitate automated data importing. The Graph IDE Xcode project is also available for customization. Your own palette of documents can be automatically loaded using a code-less plugin (available on request) so that your own DV portfolio can be seamlessly dragged and dropped within a Graph IDE document.
Use Graph IDE as a standalone retail product or as a beginning to improving your corporate workflows. Display and loading speed is particularly important when a Graph IDE programmable document is incorporated into enterprise applications. Contact VVI at support@vvi.com with your questions and for additional help and product details.
Quoi de neuf dans la dernière version ?
This release has speed, features and reliability. We are now zeroing in on perfection by fixing a handful of issues dealing with macOS 26 (Tahoe) interaction. Please contact support@vvi.com with any improvement suggestion. We are iterating to perfection and all input is welcome.