
Jockeys Tickers
iOS Universel / Finance
Jockeys Tickers is an easy-to-use app that displays digital technical analysis results for stocks, currency pairs, and market indices across Gulf, United States, Foreign Exchange, and selected other markets.
The app provides daily analysis results combined with weekly and monthly readings. It relies on automated analysis of more than forty technical indicators, covering most major types of technical indicators and helping reduce human error in technical analysis.
Key benefits:
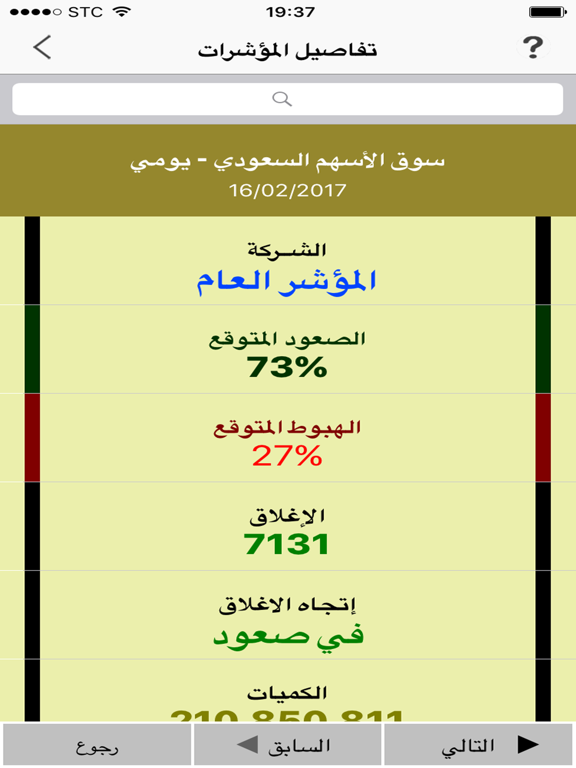
• Shows the final expected state for stocks, currency pairs, and market indices as percentages for expected rise and expected decline.
• Shows the results of all technical indicators for the daily, weekly, and monthly periods as rise and decline percentages.
• Displays the Tomorrow's Story Indicator and Candle Close Indicator for the daily, weekly, and monthly periods.
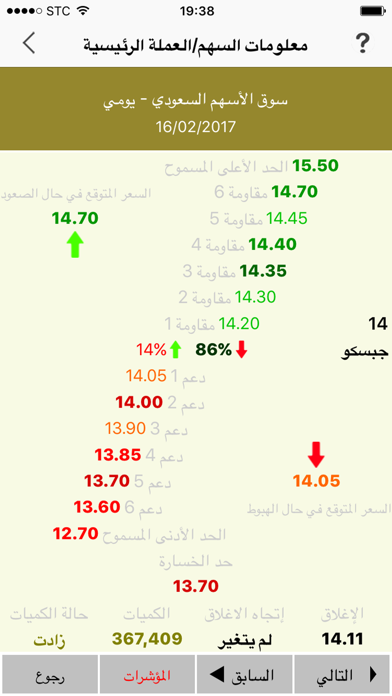
• Shows the current states, strengths, and details of Buy and Sell Zones.
• Helps users identify stocks and currency pairs with stronger technical expectations for rise or decline.
• Provides reliable positive and negative filters, strategies, rankings, and lists to save time and effort.
• Helps users screen, sort, rank, and filter markets using multiple technical signals and data points.
• Shows close-price states and trading volumes compared with the previous two periods.
• Shows expected prices in case of rise and expected prices in case of decline.
• Shows targets, including calculated, historical, corrective, moving-average-based, and Fibonacci support and resistance prices, while distinguishing weak, strong, and strongest levels.
• Shows stop-loss limit prices.
• Shows values, directions, states, and buy and sell percentages for technical indicators.
Markets covered:
• Saudi Stock Market.
• Saudi Nomu Market.
• Dow Jones 30 Stock Market.
• Nasdaq 100 Stock Market.
• Standard & Poor's 500 Stock Market.
• Foreign Exchange Market.
• Kuwait Stock Exchange.
• Dubai Financial Market.
• Abu Dhabi Securities Exchange.
• Qatar Stock Exchange.
• Bahrain Bourse.
• Muscat Securities Market.
• Egyptian Exchange.
• Amman Stock Exchange.
How the app works:
Market data is analyzed automatically after market close through the Easy Stock Analyzer program. The analysis process takes several hours, during which digital technical analysis and chart readings are performed for the daily, weekly, and monthly periods. The results are then displayed in the app in a simple digital format.
Color meanings:
• Green shades indicate positivity.
• Red shades indicate negativity.
• Darker colors indicate stronger or more important signals.
Technical indicators used include:
Moving Average Convergence Divergence, Relative Strength Index, Stochastic Oscillator, Money Flow Index, Williams Percent Range, Bollinger Bands, Accumulation Distribution, Aroon, Directional Movement Indicators, Average Directional Index, Average True Range, Commodity Channel Index, Price Channels, Qstick, Double and Triple Exponential Moving Averages, Ultimate Oscillator, Simple and Exponential Moving Averages, Momentum Indicator, Triple Exponential Average, Chaikin Volatility, Volume Oscillator, On-Balance Volume, Parabolic Stop and Reverse, Linear Regression Indicator, Projection Bands, Projection Oscillator, Envelopes, Swing Index, Accumulation Swing Index, Ease of Movement, Intraday Momentum Index, Price Oscillator, Price Rate of Change, Volume Rate of Change, Time Series Forecast, Chaikin Oscillator, Chaikin Money Flow, Relative Volatility Index, Inertia, Standard Deviation, Fibonacci Retracement, and Arms Index.
For maximum benefit from the app, we recommend reading the detailed instructions inside the app.
Quoi de neuf dans la dernière version ?
Improvements and fixes in this release:
- Improved the search field display on the stocks list screen, especially on smaller screens such as iPhone 7.
- Added and improved numeric and text data filters.
- Added and improved numeric data sorting.
- Improved the selected data display before applying filters or sorting.
- Improved handling of long numbers, negative values, and numbers with thousands separators.
- General performance and usability improvements.
- General bug fixes and improvements.